Skimpy Gimpy PNG image canvas documentation
As a fun add on the Skimpy Gimpy package includes a canvas
Python
module which makes it very easy to generate certain kinds of PNG images.
Not all PNG features are implemented, but enough are available to make
the package fun and useful. For large and complex images this package
will be slower than other methods because it is implemented in a
keep-it-simple-stupid python-only mode, but for small simpler
images it is fast enough for many uses.
As an advanced feature, the canvas includes the capability to generate
Javascript data structures which can be used to implement mouse tracking
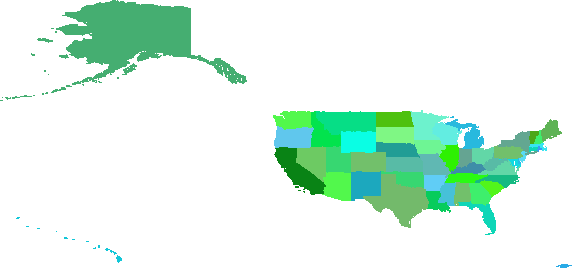
over an image created using the canvas. For example the following image
of the United States was generated using a canvas and integrated into
this document with the javascript data structures to present information
about the states when the mouse hovers above each state.
United States Mouse Tracking Example
|
State information should appear here
when the mouse hovers over one of the states.
|
This document walks through
some example uses of the module and its features.
Where do you get it?
Please go to the Skimpy Gimpy sourceforge
project page and click on the download link.
Hello World
The following example generates a "hello world" image file and demonstrates
the use of colors and generation of text.
| Program |
|---|
from skimpyGimpy import canvas
c = canvas.Canvas()

# set the foreground color to a light blue
c.setColor(99,99,0xff)

# set the background color to a dark green
c.setBackgroundColor(10,50,0)

# name a font "propell" and associate it with a BDF font file
c.addFont("propell", "../fonts/mlmfonts/propell.bdf")

# set the current font to "propell" with scale 2.0 and
# pixel radius 1.3
c.setFont("propell", 2.0, 1.3)

# draw some text
c.addText(0,0, "Hello PNG World")

c.dumpToPNG("png/HelloWorld.png")
|
generated image png/HelloWorld.png |
|---|
|
|
|---|
 |
|---|
The first two lines of this example import the canvas module
and create a Canvas object. The Canvas object
c encapsulates all information drawn to the image as well as
state information relating to the how to draw additional objects (such
as the current color, font, and rotation).
The last line of the example dumps the contents of the canvas
c to a PNG image file "HelloWorld.png".
Note that the size of the image is not specified in the example.
By default the canvas will make the image size a rectangular region
just large enough to contain all the drawn pixels. (See the
crop method below to specify the image size.)
The lines in between the first two and the last one deal with colors
and drawing text.
Colors
Before any draw operation a canvas should have a foreground "paint color"
defined using
c.setColor(R,G,B) # R,G,B in range 0..255
which defines the red, green, and blue intensities for the current
drawing color.
A canvas may also have exactly one optional background color
specified by
c.setBackgroundColor(R,G,B)
which specifies the red, green, and blue intensities for the pixels
in the image which is not explicitly drawn on. If the background color
is left out the background of the image will be transparent;
so, for example, if the image is
in a web page it will show whatever is behind it on the page, as
demonstrated in the following example.
| Program |
|---|
from skimpyGimpy import canvas
c = canvas.Canvas()

# set the foreground color to a light blue
c.setColor(99,99,0xff)

# NO BACKGROUND COLOR (TRANSPARENT)

# name a font "propell" and associate it with a BDF font file
c.addFont("propell", "../fonts/mlmfonts/propell.bdf")

# set the current font to "propell" with scale 2.0 and
# pixel radius 1.3
c.setFont("propell", 2.0, 1.3)

# draw some text
c.addText(0,0, "Hello Transparent PNG World")

c.dumpToPNG("png/TransparentWorld.png")
|
generated image png/TransparentWorld.png |
|---|
|
|
|---|
 |
|---|
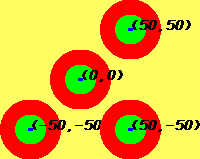
Circles and Coordinates
The following example draws a number of circles
onto a PNG image using the method
c.addCircle(centerX, centerY, radius)
which draws a circle of radius radius centered at
(centerX, centerY) using the current foreground color.
The example also demonstrates canvas coordinates
and painting over objects.
| Program |
|---|
from skimpyGimpy import canvas
c = canvas.Canvas()

# set up the font as cursive, scale 1.0
c.addFont("cursive", "../fonts/cursive.bdf")
c.setFont("cursive", 1.0)
# set the background color to pale yellow
c.setBackgroundColor(255,255,100)

# put circles and a label at (0,0)
c.setColor(255,0,0)
c.addCircle(0,0, 30) # big blue circle
c.setColor(0,255,0)
c.addCircle(0,0, 15) # medium green circle
c.setColor(0,0,255)
c.addCircle(0,0,2) # small blue circle
c.setColor(0,0,0)
c.addText(0,0, "(0,0)") # black text

# put circles and a label at (50,50)
c.setColor(255,0,0)
c.addCircle(50,50, 30) # big blue circle
c.setColor(0,255,0)
c.addCircle(50,50, 15) # medium green circle
c.setColor(0,0,255)
c.addCircle(50,50,2) # small blue circle
c.setColor(0,0,0)
c.addText(50,50, "(50,50)") # black text

# put circles and a label at (-50,-50)
c.setColor(255,0,0)
c.addCircle(-50,-50, 30) # big blue circle
c.setColor(0,255,0)
c.addCircle(-50,-50, 15) # medium green circle
c.setColor(0,0,255)
c.addCircle(-50,-50,2) # small blue circle
c.setColor(0,0,0)
c.addText(-50,-50, "(-50,-50)") # black text

# put circles and a label at (50,-50)
c.setColor(255,0,0)
c.addCircle(50,-50, 30) # big blue circle
c.setColor(0,255,0)
c.addCircle(50,-50, 15) # medium green circle
c.setColor(0,0,255)
c.addCircle(50,-50,2) # small blue circle
c.setColor(0,0,0)
c.addText(50,-50, "(50,-50)") # black text

c.dumpToPNG("png/Coords.png")
|
generated image png/Coords.png |
|---|
|
|
|---|
 |
|---|
Please note the following features of the canvas demonstrated above
- The canvas uses standard cartesian (x-right, y-up) coordinates.
- Coordinates may be negative.
- If you draw an object over another object the part of the older
object that is drawn on will be obscured. For example if we reverse the
order of the drawn circles, only the big red one would remain visible.
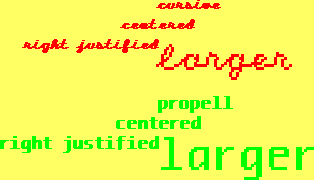
Fonts and text
The method
c.addFont(fontName, BDFFontFilePath)
names a font for internal use and associates the name with an external
BDF format font file (such as any of the fonts provided in the Skimpy
distribution).
Once a font has been named it may be set as the current font for the
canvas using the method
c.setFont(fontName, fontScale=1.0, radius=None)
The fontScale if given adjusts the size of the
font and the font radius if given adjusts the pixel radius.
BDF format fonts are defined as arrays of pixels, and the
canvas represents those pixels using circles. If the radius
is not given the canvas attempts to choose a radius that will
fill in the glyphs without making them bleed together.
The methods
c.addText(x,y, text)
c.centerText(x,y, text)
c.rightJustifyText(x,y, text)
Draws text on the canvas using the current foreground color
and the current font options, left justified, centered, or
right justified respectively with respect to the (x,y)
location.
The following example exercises various font options.
| Program |
|---|
from skimpyGimpy import canvas
c = canvas.Canvas()

# name some fonts
c.addFont("propell", "../fonts/mlmfonts/propell.bdf")
c.addFont("cursive", "../fonts/cursive.bdf")
# set colors
c.setBackgroundColor(255,255,100)
c.setColor(255,0,0)
# draw some cursive
c.setFont("cursive")
c.addText(0,200, "cursive")
c.centerText(0,180, "centered")
c.rightJustifyText(0,160, "right justified")
c.setFont("cursive", 2.5)
c.addText(0,140, "larger")
# draw some propell
c.setColor(0,255,0)
c.setFont("propell")
c.addText(0,100, "propell")
c.centerText(0,80, "centered")
c.rightJustifyText(0,60, "right justified")
c.setFont("propell", 2.5)
c.addText(0,40, "larger")

c.dumpToPNG("png/Fonts.png")
|
generated image png/Fonts.png |
|---|
|
|
|---|
 |
|---|
Note that the y coordinate for drawing text always
refers to the "base line" for the text.
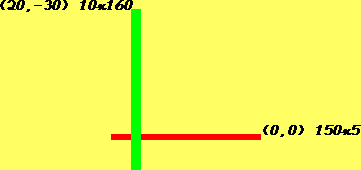
Rectangles, rotations, translations
The method
c.addRect(llx, lly, width, height)
draws a rectangle using the current forground color starting
at lower left corner (llx,lly) and extend for
width width and height height.
The following example draws a green rectangle over a red one.
| Program |
|---|
from skimpyGimpy import canvas
c = canvas.Canvas()

c.setBackgroundColor(255,255,100)
c.setColor(255,0,0)
c.addRect(0,0,150,5) # horizontal red rect
c.setColor(0,255,0)
c.addRect(20,-30, 10,160) # vertical green rect

# add some helpful labels
c.addFont("cursive", "../fonts/cursive.bdf")
c.setFont("cursive")
c.setColor(0,0,0)
c.addText(150,5,"(0,0) 150x5")
c.rightJustifyText(20,130,"(20,-30) 10x160")

c.dumpToPNG("png/Rects.png")
|
generated image png/Rects.png |
|---|
|
|
|---|
 |
|---|
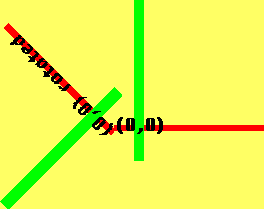
It is often very convenient to "shift" or "rotate"
the coordinate system when rendering graphics. To support
such coordinate transformation the canvas provides the
following methods
c.translate(dx, dy)
c.rotateRadians(radians)
rotate(degrees)
The following example generates two sets of rectangles like the
previous example, one unrotated, and one rotated by 135 degrees.
| Program |
|---|
from skimpyGimpy import canvas
c = canvas.Canvas()

c.setBackgroundColor(255,255,100)
c.addFont("propell", "../fonts/mlmfonts/propell.bdf")
c.setFont("propell", 1.0)

# UNROTATED
c.setColor(255,0,0)
c.addRect(0,0,150,5) # horizontal red rect
c.setColor(0,255,0)
c.addRect(20,-30, 10,160) # vertical green rect
c.setColor(0,0,0)
c.addText(0,0,"(0,0)")

# ROTATE THE COORDINATE SYSTEM
c.rotate(135)

c.setColor(255,0,0)
c.addRect(0,0,150,5) # horizontal red rect
c.setColor(0,255,0)
c.addRect(20,-30, 10,160) # vertical green rect
c.setColor(0,0,0)
c.addText(0,0,"(0,0) rotated")

c.dumpToPNG("png/RotRects.png")
|
generated image png/RotRects.png |
|---|
|
|
|---|
 |
|---|
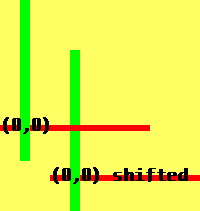
Similarly the following example draws two pairs of rectangles,
one translated to the alternate coordinate system with origin
at (-50,50).
| Program |
|---|
from skimpyGimpy import canvas
c = canvas.Canvas()

c.setBackgroundColor(255,255,100)
c.addFont("propell", "../fonts/mlmfonts/propell.bdf")
c.setFont("propell", 1.0)

# UNSHIFTED
c.setColor(255,0,0)
c.addRect(0,0,150,5) # horizontal red rect
c.setColor(0,255,0)
c.addRect(20,-30, 10,160) # vertical green rect
c.setColor(0,0,0)
c.addText(0,0,"(0,0) shifted")

# SHIFT THE COORDINATE SYSTEM
c.translate(-50,50)

c.setColor(255,0,0)
c.addRect(0,0,150,5) # horizontal red rect
c.setColor(0,255,0)
c.addRect(20,-30, 10,160) # vertical green rect
c.setColor(0,0,0)
c.addText(0,0,"(0,0)")

c.dumpToPNG("png/ShiftRects.png")
|
generated image png/ShiftRects.png |
|---|
|
|
|---|
 |
|---|
Furthermore multiple rotations and translations can be
combined as demonstrated below.
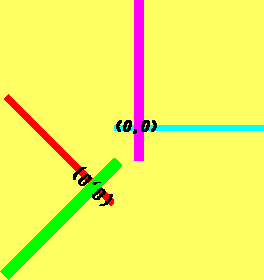
Saving and restoring the canvas state
At any time the method
c.saveState()
method will store the state of the canvas (such as its current font
and coordinate transformation) to make it easy to restore the state
later on using
c.restoreState()
For example the following example saves and restores the state
in order to return to the default coordinate transform after a rotation
and a translation.
| Program |
|---|
from skimpyGimpy import canvas
c = canvas.Canvas()

c.setBackgroundColor(255,255,100)
c.addFont("cursive", "../fonts/cursive.bdf")
c.addFont("propell", "../fonts/mlmfonts/propell.bdf")
c.setFont("cursive", 1.0, 1.2)
c.setColor(0,255,255)

# SAVE THE STATE
c.saveState()

# CHANGE THE CANVAS STATE
c.translate(-50,50)
c.rotate(135)
c.setFont("propell")

# DRAW IN CHANGED STATE
c.setColor(255,0,0)
c.addRect(0,0,150,5) # horizontal red rect
c.setColor(0,255,0)
c.addRect(20,-30, 10,160) # vertical blue rect
c.setColor(0,0,0)
c.addText(0,0,"(0,0)")

# RESTORE STATE
c.restoreState()

# DRAW IN RESTORED STATE
c.addRect(0,0,150,5) # horizontal cyan rect
c.setColor(255,0,255)
c.addRect(20,-30, 10,160) # vertical magenta rect
c.setColor(0,0,0)
c.addText(0,0,"(0,0)")

c.dumpToPNG("png/State.png")
|
generated image png/State.png |
|---|
|
|
|---|
 |
|---|
Filling Polygons
The canvas method
c.fillPolygon(pointSequence)
Fills a closed polygonal region bounded by the line segments between successive vertices of the point
sequence with the current color.
| Program |
|---|
from skimpyGimpy import canvas
c = canvas.Canvas()
c.setBackgroundColor(255,255,100)
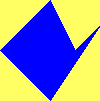
c.setColor(0,0,255)
pointSequence = [ (0,0), (50,50), (75,0), (100,25), (50,-50)]
c.fillPolygon(pointSequence)
c.dumpToPNG("png/fillPoly.png")
|
generated image png/fillPoly.png |
|---|
|
|
|---|
 |
|---|
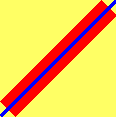
Drawing lines
The canvas method
c.addLine((x1,y2), (x2,y2))
draws a line segment starting at (x1,y1)
and ending at (x2,y2) using the current foreground
color, line cap, and line width. The methods
c.setCap(capLength)
c.setWidth(lineWidth)
The line cap specifies a distance to overshoot the end of a line
segment. The following example demonstrates these methods by
drawing a thin blue line on a thick red line.
| Program |
|---|
from skimpyGimpy import canvas
c = canvas.Canvas()

c.setBackgroundColor(255,255,100)

# thick red line with no cap
c.setColor(255,0,0)
c.setCap(0)
c.setWidth(20)
c.addLine( (0,0), (100,100) )

# thin blue line with cap=10
c.setColor(0,0,255)
c.setCap(10)
c.setWidth(2)
c.addLine( (0,0), (100,100) )

c.dumpToPNG("png/Line.png")
|
generated image png/Line.png |
|---|
|
|
|---|
 |
|---|
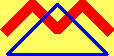
The canvas object also has the method
c.addLines(points)
c.addLines(points, closed=True)
which draws a polyline if closed
is not specified or a polygon if closed=True
built from the points sequence. For example
the following draws a blue triangle over a red
zigzag.
| Program |
|---|
from skimpyGimpy import canvas
c = canvas.Canvas()

c.setBackgroundColor(255,255,100)

# thick red line with no cap
c.setColor(255,0,0)
c.setCap(4)
c.setWidth(9)
zigzag = [ (0,25), (25,50), (50,25), (75,50), (100,25) ]
c.addLines( zigzag )

# thin blue line with cap=10
c.setColor(0,0,255)
c.setCap(10)
c.setWidth(2)
triangle = [ (0,0), (50,50), (100,0) ]
c.addLines( triangle, closed=True )

c.dumpToPNG("png/Lines.png")
|
generated image png/Lines.png |
|---|
|
|
|---|
 |
|---|
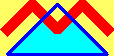
Filling regions
The method
c.growFill(x,y, stopColorRGB=None)
Fills a region in an image, much like the "paint bucket" tool
often fills a region in image creation tools like Microsoft Paint.
If the stopColorRGB is not specified the fill will start
at the (x,y) position provided and grow until the first
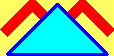
change in color in the image, as demonstrated in the following example
which fills the lower part of the triangle up to the zigzag.
| Program |
|---|
from skimpyGimpy import canvas
c = canvas.Canvas()

c.setBackgroundColor(255,255,100)

# thick red zigzag
c.setColor(255,0,0)
c.setCap(4)
c.setWidth(9)
zigzag = [ (0,25), (25,50), (50,25), (75,50), (100,25) ]
c.addLines( zigzag )

# blue triangle
c.setColor(0,0,255)
c.setCap(10)
c.setWidth(2)
triangle = [ (0,0), (50,50), (100,0) ]
c.addLines( triangle, closed=True )
c.setColor(0,255,255)

# fill to any color change
c.growFill(20,10)

c.dumpToPNG("png/fill1.png")
|
generated image png/fill1.png |
|---|
|
|
|---|
 |
|---|
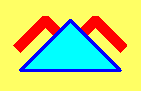
If the stopColorRGB is specified the fill will proceed until
a pixel with the given stopColorRGB is encountered. For example
the following fill stops only at the triangle, painting over the part
of the zigzag that is inside the triangle.
| Program |
|---|
from skimpyGimpy import canvas
c = canvas.Canvas()

c.setBackgroundColor(255,255,100)

# thick red line with no cap
c.setColor(255,0,0)
c.setCap(4)
c.setWidth(9)
zigzag = [ (0,25), (25,50), (50,25), (75,50), (100,25) ]
c.addLines( zigzag )

# blue triangle
c.setColor(0,0,255)
c.setCap(10)
c.setWidth(2)
triangle = [ (0,0), (50,50), (100,0) ]
c.addLines( triangle, closed=True )
c.setColor(0,255,255)

# fill to blue
c.growFill(20,10, stopColorRGB=(0,0,255))

c.dumpToPNG("png/fill2.png")
|
generated image png/fill2.png |
|---|
|
|
|---|
 |
|---|
Specifying the view region (cropping)
By default the canvas generates a rectangular image just
large enough to include all drawn pixels. If you desire
an image size different from that you may specify the size
using the method
c.crop(minx, miny, maxx, maxy):
which forces the image to range between x values minx..maxx
and y values miny..maxy.
For example the following shows the previous image on a larger
background.
| Program |
|---|
from skimpyGimpy import canvas
c = canvas.Canvas()

c.setBackgroundColor(255,255,100)

# thick red zigzag
c.setColor(255,0,0)
c.setCap(4)
c.setWidth(9)
zigzag = [ (0,25), (25,50), (50,25), (75,50), (100,25) ]
c.addLines( zigzag )

# blue triangle
c.setColor(0,0,255)
c.setCap(10)
c.setWidth(2)
triangle = [ (0,0), (50,50), (100,0) ]
c.addLines( triangle, closed=True )
c.setColor(0,255,255)

# fill to blue
c.growFill(20,10, stopColorRGB=(0,0,255))
c.crop(-20,-20, 120,70)

c.dumpToPNG("png/crop1.png")
|
generated image png/crop1.png |
|---|
|
|
|---|
 |
|---|
The following shows only the right side of the previous image
with a transparent background.
| Program |
|---|
from skimpyGimpy import canvas
c = canvas.Canvas()

# thick red zigzag
c.setColor(255,0,0)
c.setCap(4)
c.setWidth(9)
zigzag = [ (0,25), (25,50), (50,25), (75,50), (100,25) ]
c.addLines( zigzag )

# blue triangle
c.setColor(0,0,255)
c.setCap(10)
c.setWidth(2)
triangle = [ (0,0), (50,50), (100,0) ]
c.addLines( triangle, closed=True )
c.setColor(0,255,255)

# fill to blue
c.growFill(20,10, stopColorRGB=(0,0,255))
c.crop(50,-20, 120,70)

c.dumpToPNG("png/crop2.png")
|
generated image png/crop2.png |
|---|
|
|
|---|
 |
|---|
Javascript mouse tracking
The canvas object encapsulates a number of methods
to support the implementation of Javascript mouse event
callbacks for images embedded in web pages. To help
implement Javascript mouse event callbacks the canvas method
provides the following: the ability to generate the image,
the ability to generate a Javascript data structure associated
with the image, and a collection of
utility routines canvas.js. The HTML which
embeds the image must: name the image, include the canvas.js
utility routines, include the generated data structure, and define
a callback function to receive the mouse events.
The canvas object distinguishes different regions of the image
using string call back identifiers. Strings are associated
with drawn pixels in much the same way as color are associated
with drawn pixels using the following methods.
The method
c.setCallBack(callBackString)
specifies a string to deliver to the mouse tracking call back
function any pixel drawn afterwards. The method
c.resetCallBack()
Specifies that subsequently drawn pixels should not
be associate with an explicit callback string. Finally, the method
c.setBackgroundCallback(callBackString)
specifies a string to deliver to the mouse tracking call back
function for any pixel with no explicitly defined callback string.
Once the image drawing is complete, generate the Javascript data
structure to support mouse callbacks using the canvas method
c.dumpJavascript(toFileName, imageName, functionName)
where toFileName provides the path for the Javascript file to
store the data structure, imageName provides the HTML
identifier used to locate the image in the HTML file, and
functionName names the Javascript function to handle
the mouse events.
The example shown below generates an image with associated
callback strings and also prints and HTML fragment which
embeds the image and the appropriate Javascript references
inside an HTML file.
from skimpyGimpy import canvas
c = canvas.Canvas()

c.setBackgroundCallback("MOUSE OVER BACKGROUND")
c.setBackgroundColor(255,255,100)

# thick red zigzag (with callback)
c.setCallBack("MOUSE OVER ZIGZAG")
c.setColor(255,0,0)
c.setCap(4)
c.setWidth(9)
zigzag = [ (0,25), (25,50), (50,25), (75,50), (100,25) ]
c.addLines( zigzag )

# blue triangle (no callback for border)
c.resetCallBack()
c.setColor(0,0,255)
c.setCap(10)
c.setWidth(2)
triangle = [ (0,0), (50,50), (100,0) ]
c.addLines( triangle, closed=True )
c.setColor(0,255,255)

# fill to blue (with callback)
c.setCallBack("MOUSE INSIDE TRIANGLE")
c.growFill(20,10, stopColorRGB=(0,0,255))
c.crop(-20,-20, 120,70)

# store the png
c.dumpToPNG("png/mouse.png")

# store the Javascript
c.dumpJavascript("png/mouse.js", "mouseExample", "mouseExampleCallback")

# print out the html fragment using the generated image and javascript
# for mouse tracking.
HTML_FRAGMENT = """

<!-- the image using the id "mouseExample" -->
<img src="png/mouse.png" id="mouseExample">

<!-- a div for displaying callback information -->
<div id="mouseExampleDiv">
Mouse callback information will display here.
</div>

<!-- the Javascript callback "mouseExampleCallback" -->
<script>
function mouseExampleCallback(alertString, x, y, event, image) {
        // display event information in the mouseExampleDiv
	var span = document.getElementById("mouseExampleDiv");
	span.innerHTML = "mouseChart called with "+alertString+
            "<br>coords "+x+" "+y+
            " <br>event.type="+event.type+
            " <br>image.id="+image.id;
}
</script>

<!-- the Javascript utility functions -->
<script src="canvas.js"></script>

<!-- the generated data structures -->
<script src="png/mouse.js"></script>

"""
print HTML_FRAGMENT
Below the HTML code generated by the example is embedded in the present
document. Drag the mouse over the image to see the mouse events
reported below the image (on supported browsers, with Javascript enabled).

Mouse callback information will display here.
Note that the generated data structures make reference to the callback function
and the image object and therefore must follow the definition of both
the image and the callback function.
The callback function should have the following signature
function mouseExampleCallback(alertString, x, y, event, image)
where alertString provides the string associated for the
region under the mouse, (x,y) provide the coordinates for
the pixel in the image under the mouse, event is the
Javascript event object, and image is the HTML/DOM image
object.
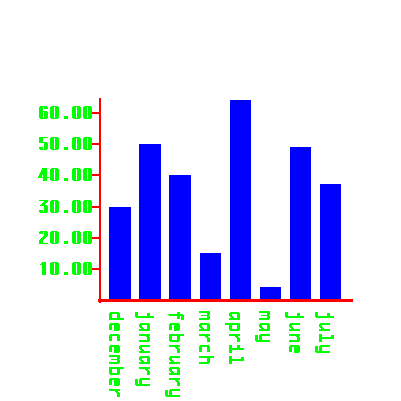
Bar Chart Example
As an extended demonstration of how to use the canvas
capabilities SkimpyGimpy ships with two experimental
modules pngBarChart
and pngPieChart which generates charts.
Please look at the source of this module for more information.
An example bar chart.